

Saanvi Talwar – saanvi2369@alyssasychan
September 30th, 2025
Edited by the YNPS Publications team.
Abstract
Risk-taking is variably identified during adolescence with long-term consequences. In the present study, explainable deep learning (XDL) applied to resting-state functional magnetic resonance imaging (rs-fMRI) connectivity will be used to predict individual differences in adolescents’ risk-taking behaviour and discover brain network features that guide such predictions. Our research question: Could a convolutional neural network, which was trained on functional connectivity matrices ( rs-fMRI ), predict adolescent risk-taking better than traditional models, and could identify interpretable approaches that indicate stable brain network biomarkers? We will preprocess data (motion correction, parcellation, connectivity matrix construction), train models with nested cross-validation, and extract predictive features with Layer-Wise Relevance Propagation (LRP) and associated tools of XAI using a large and existing dataset (e.g., ABCD Study, age range of approximately 9-18). We anticipate that the model will perform well compared to linear regression/ridge baseline and that reward, default-mode, and control network (e.g. fronto-striatal, fronto-parietal) relationships will be identified as generally significant. This kind of finding can be used to identify adolescents at risk early, guide interventions, and add to neuroscience theory on which networks are central to risk behaviour.
Introduction
History and importance.
Adolescence is a developmental stage characterised by a high degree of risk-taking, although not all adolescents pursue risky behaviour equally. This might be prevented and treated individually by understanding the mechanisms of brain circuits involved in such individual differences (Tapia Medina et al., 2025). The resting-state functional connectivity (rs-FC) is also correlated with risk behaviour in adolescents: risk-taking may be linked to increased connectivity between emotion regulation and reward sensitivity networks (e.g., DeWitt et al., 2014) as well as to default-mode networks. To a large extent, the above work employed more basic statistical models or seed-based correlations that might not be able to capture the entire multivariate pattern of connectivity.
Deep learning (DL) has the potential to boost predictive power. In combination with explainable AI (XAI) methods, such as Layer-Wise Relevance Propagation (LRP), DL models can predict as well as explain the importance of features (connections) (Bohle, Eitel, Weygandt, and Ritter, 2019; Farahani et al., 2022). As an example, Bohle et al. (2019) have applied LRP to uncover brain voxel-level heatmaps to drive the classification of Alzheimer’s Disease with MRI.
Based on this, we plan to use an explainable DL to elucidate adolescent rs-fMRI connectivity to predict risk-taking and to identify biomarkers.
Research question / Hypotheses.
● Research question: Can a convolutional neural network (CNN) trained on whole-brain rs-FC matrices be reliable at predicting individual risk-taking behaviour in adolescents, and outperform linear/ridge regression, and are their network-level biomarkers interpretable using interpretability methods (LRP, saliency)?
● Hypotheses:
1. The explainable DL model (CNN + interpretability) will be more effective than regression/ridge/rand-forest baselines (greater explained variance; less mean absolute error) to predict risk-taking behaviour.
2. Interpretability will always entail links between the fronto-striatal reward system, fronto-parietal cognitive control system, and default mode network (DMN) as being major contributors.
3. The identified features will demonstrate cross-validation fold stability and generalise to independent holdout samples (i.e., other sites or time wave).
Methodology
Participants and dataset
We will be utilising the results of the Adolescent Brain Cognitive Development (ABCD) study (ages of the order of 9-18) or some other large publicly available adolescent sample with the use of rs-fMRI and behavioural risk-taking measures (e.g., self-report or tasks). We anticipate that we will have a sample size greater than 1,000 following data cleaning. Inclusion criteria: usable rs-fMRI scans (e.g. mean framewise displacement < 0.3 mm), complete behavioural measures of risk, appropriate demographics (balanced for sex, age).
Feature extraction and preprocessing.
● Automatic preprocessing: spatial normalisation, motion correction, nuisance regression (white matter, CSF), temporal filtering.
● Parcellation: extract time series of individual nodes using a reliable atlas (e.g. Schaefer 200 parcel atlas or analogous).
● Connectivity: compute pair-wise functional connectivity (Pearson correlation, Fisher z-transformed) between nodes – gives a connectivity matrix (e.g. size of about 200 x 200).
● Potential extra characteristics: graph metrics, network membership (within vs between large networks).
Modeling approach
● Model: CNN structure modified to connectivity matrices (use matrix as 2D input), which can be augmented with attention modules to enable emphasis on significant areas.
● Baselines: ridge regression (linear), random forest, perhaps more basic neural networks.
● Training: nested cross-validation (outer folds to evaluate; inner folds to hyperparameter tune); age, sex stratified to prevent bias.
● Regularisation methods: dropout, weight decay.
● Performance measures: explained variance (R2), mean absolute error (MAE), correlation of predicted and actual risk behaviour.
Explanation/interpretability.
● Propagate relevance scores of input connections with Layer-Wise Relevance Propagation (LRP). Bohle et al. (2019) showed that LRP with MRI-based classification gave relevance to heatmaps that were compatible with known disease regions.
● arXiv
● Gradient-based attribution or saliency mapping as alternative interpretability checks.
● Measure feature stability: e.g. measure the overlap (e.g. top-1% most relevant connections) between folds. Computed network-level summaries, that is, relevance grouped on canonical networks (reward, control, DMN, limbic).
Confound control and statistical test.
● Adjustment of age, sex, scanner location, and head motion as covariates.
● Sensitivity analyses: e.g., do not include high motion subjects, check generalisation across sites.
● Significance testing: permutation tests (e.g., 1000 permutations of behavioural labels ) to determine whether model performance is greater than random chance. To be interpretable, test that the importance of identified networks is larger than one would expect when considering random attribution.
Results (planned reporting)
Planned reporting
● Model performance: The model performance R2, MAE, and correlation, with confidence intervals, compares the performance of the DL and baseline models, and tests the statistical significance of the differences.
● Result visualisations: predicted vs observed risk behaviour scatterplots; heatmaps of relevance scores on connectivity matrices; bar-plots of network-level importance (averaged across subjects/folds).
● Tables with summations of covariate effects, motion effects, and generalisation results.
Discussion
Interpretation and implications
● In case those hypotheses are proved to be correct, the findings would indicate that the multivariate patterns of rs-FC, especially reward, control, and default mode networks, are important in explaining individual risk-taking. This may assist in refining theories of adolescent development (e.g. dual systems, imbalance models).
● Clinical uses: risk-taking behaviour identification in early childhood, interventions (cognitive control training, reward sensitivity modulation).
Figures, Tables, and Graphs
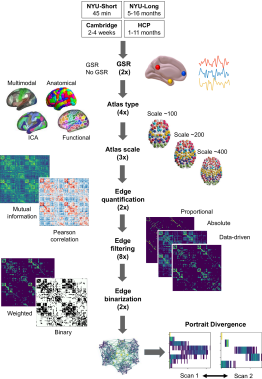
Figure 1: Pipeline diagram indicating: (A) data acquisition (rs-fMRI + behavioural risk measures), (B) preprocessing (motion correction, nuisance regression, parcellation), (C) connectivity matrix construction (Pearson r – Fisher z), (D) CNN model training with nested cross-validation and regularisation. (E) interpretability (LRP, saliency mapping), (F) feature stability and network summarisation. (Source: author’s design)
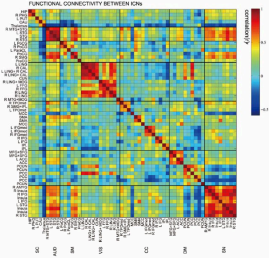
Figure 2: Averaged relevance heatmap over connectivity matrix (warm colours in the top 1% relationships popular in risk prediction). Right: bar plot of averaged values of significance of canonical networks (e.g. fronto-striatal, default-mode, fronto-parietal, limbic) and inter-network correlations. The results will be displayed in the following table:(Thresholds and methods as given in text; source: author’s model output)
Limitations
● Cross-sectional data do not allow making inferences regarding causality or developmental patterns. Replication over time is required.
● Deep learning models are subject to overfitting; with regularisation, the sample might contain biases (e.g. demographic, scanner differences).
● The process of interpretability is inexact; the various methods of attribution can provide varying sets of features.
Future directions
● Extend the model to longitudinal data in order to predict the future risk-taking patterns. ● Go beyond modalities (e.g. structural MRI, task fMRI, diffusion MRI) to be more predictive.
● Learn about causal modelling (effective connectivity) to learn the directional effects. Conclusion
Summary and next steps
This proposal outlines a proposal to take advantage of explainable deep learning on adolescent rs-fMRI connectivity to predict risk-taking behaviour and elicit interpretable biomarkers. Provided that it works, this method might be more predictive and neuroscientifically informative than conventional statistical techniques, and may enable us to inform interventions and to enhance theoretical knowledge of the risk behaviour in adolescence.
References
1. Böhle, M., Eitel, F., Weygandt, M., & Ritter, K. (2019). Layer-wise relevance propagation for explaining deep neural network decisions in MRI-based Alzheimer’s disease classification. Frontiers in Aging Neuroscience, 11, 194. https://doi.org/10.3389/fnagi.2019.00194
2. Tapia Medina, M. G., Cosío-Guirado, R., Peró-Cebollero, M., Cañete-Massé, C., Villuendas-González, E. R., & Guàrdia-Olmos, J. (2025). The clinical relevance of healthy neurodevelopmental connectivity in childhood and adolescence: a meta-analysis of resting-state fMRI. Frontiers in neuroscience, 19, 1576932. https://doi.org/10.3389/fnins.2025.1576932
3. DeWitt, S. J., Aslan, S., & Filbey, F. M. (2014). Adolescent risk-taking and resting state functional connectivity. Psychiatry Research: Neuroimaging, 222(3), 157-164. https://doi.org/10.1016/j.pscychresns.2014.03.007
4. Farahani, F. V., Karwowski, W., & Lighthall, N. R. (2022). Application of explainable artificial intelligence to neuroimaging: A review. Frontiers in Neuroscience, 16, 906290. https://doi.org/10.3389/fnins.2022.906290 5. Van Essen, D. C., Smith, S. M., Barch, D. M., Behrens, T. E., Yacoub, E., Ugurbil, K., & the WU-Minn HCP Consortium. (2013). The WU-Minn Human Connectome Project: An overview. NeuroImage, 80, 62-79. https://doi.org/10.1016/j.neuroimage.2013.05.041

Leave a comment